The Great Salt Lake's level is reported as an elevation in feet above sea level, measured at a gauge in the south arm. Higher numbers mean a bigger lake, and the range between the record low and record high is about 23 feet. Because the lake is so shallow, those 23 feet separate a lake smaller than 1,000 square miles from one roughly twice that size. This guide explains what the gauge records, where the agencies' numbers agree and differ, and how to read the lake's level for yourself without relying on a stale figure.
| South arm gauge | Saltair Boat Harbor, USGS Station 10010000 |
| Datum | Feet above NGVD 1929 |
| Record low | 4,188.5 feet, Nov. 7, 2022 (USGS) |
| Record high | 4,211.60 feet, June 3, 1986 (USGS) |
| Approximate historical average | About 4,200 feet (USGS) |
| Normal yearly swing | One to two feet (state) |
| Drive from Provo | About an hour to the state park near Magna |
What the gauge measures
The USGS gauge at Saltair Boat Harbor records the water-surface elevation of the south arm. The number is a height above a fixed reference point, not a depth. The USGS gives its record highs and lows above NGVD 1929, and it describes the Saltair station as being at the southern end of the lake, with a record running back to 1847 when combined with other data. Water-surface elevation data have been collected since 1875, and continuously since October 1902.
The USGS lists two other stations. Station 10010024 is on the south side of the causeway, and Station 10010100 is the North Arm near Saline, Utah, which USGS says has been monitored since April 1966. The reason there is more than one gauge is the railroad causeway, completed in 1959 and described by USGS as dividing the lake into two parts. The two arms do not sit at the same level. KSL reported in February 2024 that the south arm was more than 3 feet higher than the north arm after state work on the causeway breach. So when someone says "the lake is at" a number, they almost always mean the south arm, and the north arm can be somewhere else.
One caution on datums. USGS's 2023 topobathymetric data release for the lake uses a different vertical datum, NAVD 88, in meters, rather than NGVD 1929 in feet. If you pull elevations from different products, check the datum before you compare them. USGS also notes that one acre-foot is about 326,000 gallons, which helps make sense of the volumes below.
What the feet mean for size
USGS's elevation tables connect level to size. At about 4,200 feet the lake covers about 1,700 square miles and holds about 16 million acre-feet of water. The state's Great Salt Lake website agrees on the area and adds that the lake at that level is roughly 75 miles long and 35 miles wide. At the 1986 record high, 4,211.60 feet, USGS says the lake covered roughly 2,300 square miles. In 2022, near the record low of 4,188.5 feet, it covered less than 1,000 square miles. Because the lake is shallow, a small change in feet is a large change in area.
Where the sources differ
The state and USGS do not give identical numbers, and the differences are worth knowing before you quote either.
| Item | USGS | State website |
| 1986 record high | 4,211.60 feet | 4,211.65 feet |
| Area at 1986 high | About 2,300 sq. mi. | 3,300 sq. mi. |
| Area at 2022 low | Less than 1,000 sq. mi. | About 800 sq. mi. |
The state's 3,300 figure, it says, includes areas flooded when the pumps were operating and the west desert flooded. The USGS page does not explain its 2,300 figure in the text we read, so we cannot say whether the two measure the same thing. The 0.05-foot difference in the high may come from different gauges, datums or rounding, but neither page says. We use USGS for the gauge record and give the state's numbers beside them rather than choosing one.
USGS also notes an older benchmark. A 1984 report covering 1847 to 1982 listed a low of about 4,191 feet and a high of about 4,212 feet, so the 2022 reading fell below the lowest level listed for that 1847 to 1982 period.
The records and how fast the lake can move
USGS lists the record rise as 5.2 feet, from September 18, 1982 to June 30, 1983. A 1984 report on the 1982 to 1983 rise put it at from about 4,200 to about 4,205 feet. In the other direction, USGS says the level fell below the October 2021 historic low on July 3, 2022, and notes that on July 24, 2021 it had been about an inch below the previous record. It reports a new north arm record low on December 29, 2015, with no value given.
The state's page describes a smaller, regular rhythm: the lake typically fluctuates one to two feet within a year, peaking during spring runoff and reaching a seasonal low in October or November. The state also says the lake rose about 6.5 feet between November 2022 and May 2024, following two heavy snowpack years. That is a useful reminder that one wet winter cannot undo a long decline but can move the gauge noticeably. We do not state where the lake sits today. Because the seasonal low falls in October or November, an autumn reading is typically near the bottom of the yearly cycle, which is one reason to compare a reading with the same time of year.
Why it changes
The state's Great Salt Lake website says three rivers, the Bear, Weber and Jordan, feed the lake and nothing flows out, and that it loses about 2 million acre-feet a year to evaporation. Its current conditions page adds that runoff from the Uinta, Wasatch and Bear River ranges supplies most of the water, with the three rivers providing nearly 70 percent.
USGS gives a long-run water budget for the lake from a 1978 report, using 1931 to 1976 averages. Average annual inflow was about 2.9 million acre-feet, made up of about 1.9 million from surface sources, about 900,000 from precipitation falling directly on the lake and about 75,000 from groundwater. Outflow was all evaporation, but the figure is cut off on the page we read. Those are historical averages from a particular period, not current conditions, and they are not directly comparable to the state's recent evaporation figure. They do show the logic: the level goes up when inflow beats evaporation and down when it doesn't.
Our salinity explainer covers what that does to the salt level. For the other big lake in the region, the freshwater one next to Provo, see our Utah Lake history and Utah Lake guide.
Why a few feet matters
The state's main page lists what a drying lake can mean: more dust, worse air quality, less snow, limited access to the lake and habitat loss. It says the lake supports as many as 12 million migratory waterfowl and waterbirds a year and contributes more than $2 billion annually to Utah's economy. The Division of Wildlife Resources describes brine shrimp in tons, brine flies in billions and birds in millions.
KSL, in a July 2026 report on a dust storm, quoted University of Utah atmospheric scientist Kevin Perry saying the most effective long-term solution is raising lake levels, because that reduces exposed lakebed. The article said dust events occur about three to eight times a year. That is one researcher's view reported by a news outlet, and the Utah Division of Air Quality, which the article said is installing new monitors, is the source for air quality data.
What visitors notice at different levels
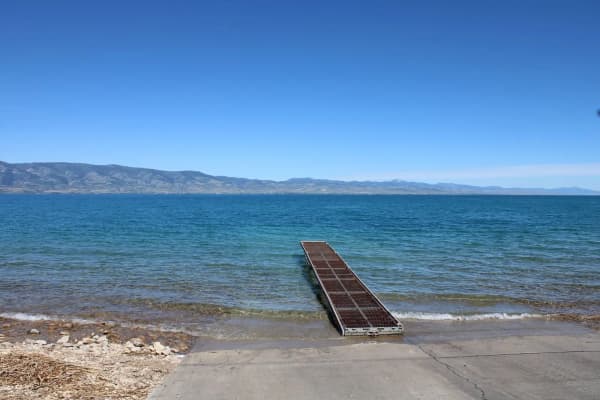
None of the sources we read give a table of what visitors see at each elevation, and we won't invent one. What they do establish is that level affects access. Utah State Parks' Antelope Island page said, when we read it, that the main boat ramp was closed because of low water and pointed to a separate page for other ramps. The same page lists sandy beaches, swimming or floating in the highly saline water, and Bridger Bay Beach as the best place for it, with restrooms and showers. Great Salt Lake State Park lists a marina, boat tours, paddleboard and tandem kayak rentals and swimming, and does not mention lake level on its page, though it links to the state's lake website for research and management.
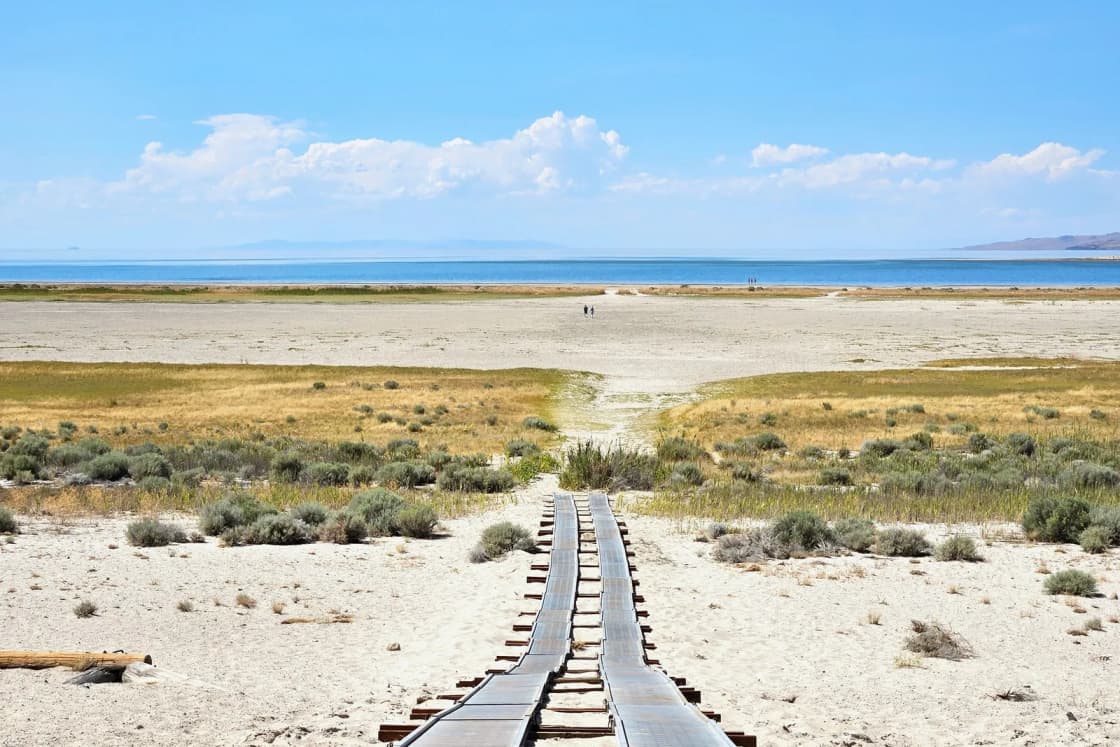
The practical rule, which is our reading and not a state statement, is that a lower lake can mean a longer walk to the water where the shoreline is shallow, and a boat ramp can become unusable. If you plan to launch a boat or paddle, check the park's ramp status first. If you plan to walk the shore or watch birds, level matters less.
Checking the level yourself
We don't print a current reading, because it changes and we did not read a live gauge today. The state's current conditions page, which we found last updated July 27, 2026, shows lake level, salinity and streamflow as embedded graphs and links to the USGS Hydro Mapper at webapps.usgs.gov/gsl, the Utah Division of Water Resources' lake elevation graph, and USDA snowpack data. USGS Station 10010000 is the gauge to search for if you want the raw number. When you look, note three things: which arm the number refers to, which datum it uses, and the date and time of the reading.
Visiting from Provo
The nearest easy access points are about 50 to 60 miles north, roughly an hour, at Great Salt Lake State Park near Magna and the Antelope Island causeway at Syracuse, per our Great Salt Lake and Bonneville Salt Flats day trip. Our Antelope Island guide says to take I-15 north to Exit 332 and to budget two hours. The state park keeps hours of sunrise to 5 p.m., and Antelope Island is open 6 a.m. to 10 p.m. and closed Thanksgiving and Christmas, per Utah State Parks. For the lake's north arm, see the Spiral Jetty and Golden Spike trip guide. For other options on a free Saturday, see day trips from Provo and the Salt Lake City day trip. Students writing a paper on the lake can pair the gauge numbers here with the Survey's salinity averages in the salinity guide.
Who should skip it
Skip this if you want a current level or a forecast; use the live gauge. Skip it if you need a legal or engineering number, such as a mapping elevation, because the datum and arm questions above need a primary USGS source. If you are only planning a day at the lake, the day trip and Antelope Island guides are better starting points.
What we could not confirm
We could not confirm a current level, the reason the USGS and state figures for 1986 differ, or any elevation-by-elevation account of what visitors see. We did not read a live gauge page, so the figures here are records and averages only. Check the sources above for today's number.
Frequently Asked Questions
Where is the Great Salt Lake's main gauge?
What is the record low level?
What is the record high level?
What is a normal level?
How big is the lake at different levels?
Why do the USGS and the state give different area figures for 1986?
What is the lake's level today?
Why does the level matter for salinity?
Do the two arms have the same level?
Does the level change what visitors see?
Sources
The facts in this guide were checked against these sources. Hours, fees and rules change, so confirm anything time-sensitive with the source before you go. How we make Provo.com.
- Great Salt Lake Elevations and Records, USGS Utah Water Science Center. Checked November 4, 2026.
- Salt Crust on Great Salt Lake's North Arm, Utah Geological Survey. Checked November 4, 2026.
- Great Salt Lake, State of Utah. Checked November 4, 2026.
- Great Salt Lake Current Conditions, State of Utah. Checked November 4, 2026.
- What's in Great Salt Lake dust?, KSL. Checked November 4, 2026.