Utah fits a 102-degree July afternoon and a 458-inch snow year inside one state, and both are a day's drive from Provo. Planning a trip around "Utah weather" means picking the right region for the month, not the right month for the state. This guide lines up the official 30-year averages for nine stations, from St. George to Alta to Vernal, and pairs them with the warnings the National Park Service publishes for the parks most Utah Valley families and students drive to.
The temperatures, precipitation and snowfall below are NOAA's 1991-2020 U.S. Climate Normals, downloaded from the National Centers for Environmental Information (NCEI) on Nov. 13, 2026. NCEI says the official normals are "calculated for a uniform 30 year period" and are produced every 10 years, in line with National Weather Service requirements. Where a park publishes its own table, we note it. For which park is closest, start with our Utah national parks from Provo, ranked guide; this page is the weather detail behind its season advice.
| Item | Detail | Source |
|---|---|---|
| Data used | 1991-2020 monthly climate normals | NOAA NCEI |
| Hottest July normal high | St. George, 101.9 degrees | NOAA NCEI |
| Snowiest station | Alta, about 458 inches a year | NOAA NCEI |
| Coldest January normal high | Vernal, 29.2 degrees | NOAA NCEI |
| Monsoon season | Usually July through September | NPS (Zion, Capitol Reef) |
| Desert parks' best seasons | April-May and mid-September through October | NPS (Arches, Canyonlands) |
| Daily temperature swing | Sometimes over 40 degrees in a day | NPS (Arches, Canyonlands) |
| Provo normal precipitation | 17.19 inches a year | NOAA NCEI |
| Road weather and cameras | udottraffic.utah.gov | UDOT |
Who this guide is for
It is written for anyone in Utah Valley picking dates for a trip somewhere else in the state: a family weighing a spring-break week in St. George against a Moab weekend, a BYU or UVU student planning a fall-break campsite, a parent trying to figure out whether July at Bryce is a better idea than July at Zion. It also works for visitors staying in Provo who want to know what the rest of the state is doing in the month they're here.
It is not a forecast. A normal is a 30-year average, and any single week can land far from it. NCEI itself cautions that the normals "were not developed to track or document climate change." Use this page to decide where and when, then use the National Weather Service forecast to decide whether.
How to read the numbers
Every station below is a specific weather station, not a whole region. The station name matters because elevation drives most of Utah's weather, and two places 30 miles apart can sit 4,000 feet apart. Here are the stations, their elevations from NCEI's station records, and driving estimates from downtown Provo. The national park times come from our parks ranking page; the others are OpenStreetMap routing (OSRM) estimates we ran on Nov. 13, 2026, with no traffic or stops.
| Region | NOAA station (elevation) | From Provo (est.) |
|---|---|---|
| Wasatch Front valleys | Provo BYU (4,570 ft); Salt Lake City airport (4,225 ft) | Home; about 1 hr to the airport |
| Wasatch high country | Alta (8,710 ft) | About 44 mi, 1 hr 5 min |
| Uinta Basin | Vernal (5,345 ft) | About 154 mi, 3 hr 5 min |
| Canyon country, southeast | Moab (4,053 ft) | Arches about 3 hr 43 min |
| Capitol Reef and the San Rafael desert | Hanksville (4,308 ft) | About 187 mi, 3 hr 47 min |
| High plateaus | Bryce Canyon headquarters (7,890 ft); Cedar City airport (5,586 ft) | Bryce about 4 hr 4 min; Cedar City about 3 hr 28 min |
| Southwest desert | St. George (2,857 ft); Zion National Park (4,038 ft) | St. George about 4 hr 20 min; Zion Canyon about 4 hr 36 min |
The routes are the familiar ones. Southern Utah trips leave on I-15 south; Zion and St. George stay on it, Bryce and Capitol Reef leave it for two-lane highways east of the interstate. Moab and Arches go by US-6 through Spanish Fork Canyon to Price and Green River, then US-191. Vernal goes east through Heber on US-40. Alta is up Little Cottonwood Canyon from the south end of the Salt Lake Valley.
Average highs by month
All figures are NOAA 1991-2020 normals in degrees Fahrenheit, rounded to the nearest degree.
| Month | Provo | Alta | Vernal | Moab | Bryce | St. George | Zion |
|---|---|---|---|---|---|---|---|
| Jan | 41 | 31 | 29 | 44 | 37 | 54 | 54 |
| Feb | 48 | 31 | 37 | 52 | 39 | 59 | 58 |
| Mar | 58 | 37 | 51 | 65 | 46 | 68 | 66 |
| Apr | 66 | 42 | 60 | 72 | 54 | 75 | 73 |
| May | 76 | 53 | 70 | 83 | 63 | 85 | 84 |
| Jun | 87 | 64 | 81 | 94 | 75 | 96 | 95 |
| Jul | 95 | 73 | 89 | 99 | 80 | 102 | 100 |
| Aug | 93 | 71 | 86 | 96 | 78 | 100 | 98 |
| Sep | 83 | 62 | 76 | 88 | 70 | 92 | 91 |
| Oct | 69 | 50 | 61 | 74 | 58 | 79 | 78 |
| Nov | 53 | 37 | 46 | 57 | 46 | 64 | 64 |
| Dec | 41 | 30 | 31 | 44 | 37 | 53 | 53 |
Average lows by month
| Month | Provo | Alta | Vernal | Moab | Bryce | St. George | Zion |
|---|---|---|---|---|---|---|---|
| Jan | 24 | 15 | 10 | 21 | 17 | 28 | 30 |
| Feb | 28 | 15 | 17 | 27 | 18 | 32 | 34 |
| Mar | 35 | 20 | 27 | 36 | 23 | 39 | 39 |
| Apr | 40 | 25 | 34 | 43 | 29 | 46 | 44 |
| May | 47 | 33 | 43 | 51 | 37 | 56 | 53 |
| Jun | 55 | 42 | 51 | 59 | 45 | 65 | 62 |
| Jul | 62 | 50 | 57 | 66 | 52 | 72 | 70 |
| Aug | 61 | 49 | 55 | 64 | 50 | 70 | 69 |
| Sep | 52 | 41 | 46 | 55 | 42 | 61 | 61 |
| Oct | 41 | 31 | 35 | 42 | 32 | 47 | 49 |
| Nov | 32 | 21 | 24 | 30 | 23 | 35 | 37 |
| Dec | 24 | 15 | 13 | 22 | 17 | 28 | 29 |
Two patterns jump out. First, the southwest desert runs about 13 degrees warmer than Provo in January and about 5 to 7 degrees warmer in July, so St. George is a winter escape more than a summer one. Second, Bryce and Alta run 12 to 23 degrees cooler than Provo from June through August, which is why the high country is where July trips work best.
Heat days, freeze nights and yearly totals
NCEI's normals also count how many days a year a station reaches certain thresholds. These are the numbers that matter most for a hiking plan.
| Station | Days 100 or hotter | Nights 32 or colder |
|---|---|---|
| St. George | About 63 | About 63 |
| Zion National Park | About 50 | About 71 |
| Hanksville | About 39 | About 149 |
| Moab | About 38 | About 117 |
| Provo BYU | About 9 | About 111 |
| Salt Lake City airport | About 8 | About 112 |
| Cedar City airport | About 1 | About 169 |
| Vernal | Under 1 | About 174 |
| Bryce Canyon | 0 | About 216 |
| Alta | 0 | About 210 |
And the yearly precipitation and snowfall normals:
| Station | Precipitation (in.) | Snowfall (in.) |
|---|---|---|
| Alta | 47.08 | 458.3 |
| Provo BYU | 17.19 | 44.9 |
| Bryce Canyon | 16.65 | 86.7 |
| Zion National Park | 16.27 | 4.0 |
| Salt Lake City airport | 15.52 | 51.9 |
| Cedar City airport | 11.04 | Not published |
| St. George | 9.31 | 1.2 |
| Moab | 9.13 | 9.3 |
| Vernal | 9.08 | 20.4 |
| Hanksville | 6.16 | 7.3 |
NCEI does not publish a snowfall normal for the Cedar City airport station, so none is given here. Hanksville, the closest of these stations to Capitol Reef, is the driest on the list at about 6 inches of precipitation a year.
The regions, one at a time
Wasatch Front valleys: Provo and Salt Lake City
This is the baseline. Provo's normal July high is 95.2 degrees and its January high 41.2, with 17.19 inches of precipitation and 44.9 inches of snow a year. The Salt Lake City airport station runs a few degrees cooler in summer and a bit snowier, at 51.9 inches. May is Provo's wettest month in the normals, at 2.01 inches, and July its driest, at 0.51.
The practical point for trip planning: whatever the weather is doing in Provo, most of southern Utah is warmer and drier, and the mountains are colder and wetter. Our Provo weather by month page covers the valley in full, including the winter inversion.
Wasatch high country: Alta
Alta is the snow number most people have heard of, and the normals back it up: about 458 inches a year, with 81.2 inches in a normal February, 79.8 in December and 74.7 in January. Snow is still in the normals in May (15.9 inches) and October (24.4). The station averages zero days at 90 degrees or hotter in any month. July's normal high is 72.9 degrees and the low 50.3, which makes Little Cottonwood a summer cool-off about an hour from Provo by our estimate. Our Cottonwood Canyons summer guide covers that side of the canyon.
Winter is a different trip. The canyon road falls under Utah's traction law, which UDOT says can require compliance "up to 24 hours before a storm." For the Cottonwood Canyons' stricter Class 3 segments, UDOT lists acceptable tires with 5/32-inch tread depth or traction devices. Our Utah winter driving guide explains the rules in detail. If you plan to leave the resort boundary, check the daily backcountry avalanche forecast first.
Uinta Basin: Vernal
Vernal surprises people. Its January normal high of 29.2 degrees is lower than Alta's 30.7, even though Alta sits more than 3,000 feet higher, and its January low averages 10.0 degrees against Alta's 15.0. The normals record what happened, not why, but basin floors in Utah are known for trapping cold air in winter, the same pattern behind the Utah Valley inversions described in our inversion and air quality guide.
Summer is warm but not desert-hot: an 88.7-degree July high and less than one day a year at 100 degrees. The station gets 9.08 inches of precipitation a year, with September (1.22 inches) and October (1.15) the wettest months, and about 20 inches of snow. For a Dinosaur National Monument or Flaming Gorge trip, May through September is the comfortable window by these numbers. In winter, check UDOT's road weather for US-40 before leaving.
Canyon country: Moab, Arches and Canyonlands
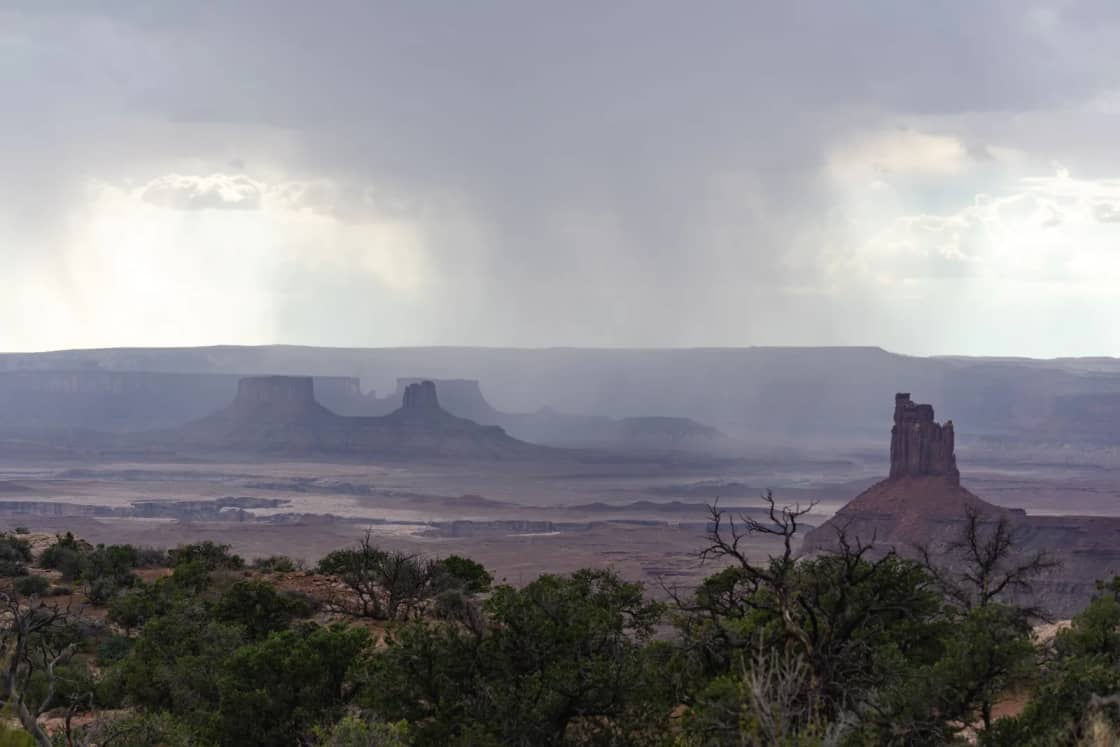
Moab's normals: a 99.2-degree July high, about 38 days a year at 100 or hotter, and a January high of 43.5 with a low of 21.4. Precipitation is 9.13 inches a year, spread evenly enough that no month tops 1.03 inches (October). Snow averages 9.3 inches a year, most of it in December.
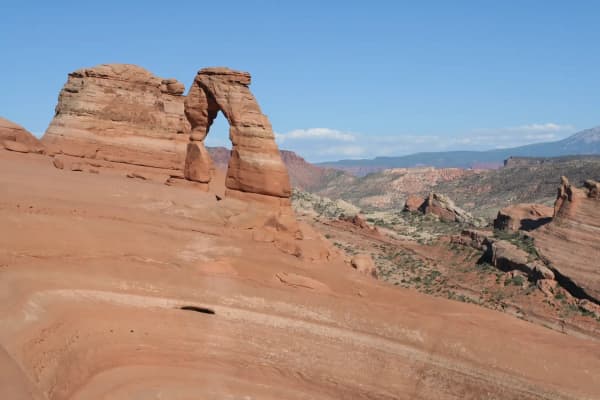
The Park Service almanac tables for Arches and Canyonlands, which match each other, line up with this: July averages a 100-degree high with 16 days over 100, and the record is 116 in July. The Park Service calls spring (April through May) and fall (mid-September through October) the most popular seasons, with daytime highs averaging 60 to 80 degrees and lows averaging 30 to 50. It says "summer temperatures often exceed 100ºF, making strenuous exercise difficult," and that late-summer monsoon season brings "violent storm cells which often cause flash floods."
Winter is quiet and cold: highs average 30 to 50, lows 0 to 20, and January averages 28 days below freezing in the park table. The Park Service says large snowfalls are uncommon, but even small amounts of snow or ice can make local trails and roads impassable. It also notes that temperatures can swing "sometimes over 40 degrees in a single day," which is the reason to pack for both ends of the day in April and October. Our Moab from Provo guide covers the drive and lodging.
Capitol Reef and the San Rafael desert
Capitol Reef publishes its own 1991-2020 averages for the Fruita visitor center: a July high of 91 and low of 65, a January high of 41 and low of 20. The park says it averages 7.91 inches of precipitation a year at the visitor center, and most of it falls in the summer monsoon, usually July through September, when downpours can cause dangerous flash floods. Its precipitation table shows August (1.14 inches) and July (1.05) as the wettest months.
The park splits its forecasts into three areas because weather varies across its length: Fruita, the North District with Cathedral Valley, and the South District with the Burr Trail. Those forecasts include a flash flood potential rating and heat risk. The park lists a phone number for the daily Fruita forecast: (435) 425-3791, then press 1, then 3.
Hanksville, east of the park on the way to Goblin Valley and the San Rafael Swell, is hotter and drier: a 98.7-degree July high, about 39 days at 100 or above, and 6.16 inches of precipitation a year. Its September and October normals (0.83 and 0.87 inches) are the wettest months. Our Capitol Reef from Provo guide covers the orchards and the drive.
High plateaus: Bryce Canyon and Cedar City
Bryce is the summer answer. NOAA's normals give the park headquarters station an 80-degree July high and a 77.5-degree August high, and on average about half a day a year at 90 or hotter. The Park Service's own table, which differs slightly in a few months, shows the same shape: 80 in July, 77 in August, and lows near 50.
The trade-off is weather that moves fast. The Park Service says July and August are the rainy season, with frequent, usually brief afternoon thunderstorms bringing heavy rain and frequent lightning, and its table counts 11 thunderstorm days in July and 12 in August. "Lightning kills," the page says. "When thunder roars go indoors!"
Then there's the cold. The normals count about 216 nights a year at 32 or colder, and the Park Service says that from October to May, temperatures drop below freezing nearly every night. December through February is the coldest and snowiest stretch, and storms in March and April can still bring heavy snow that affects travel. NOAA's normals give about 87 inches of snow a year; the Park Service table lists 17 inches in January and 18 in February, with a record of 82 inches in one January. The Park Service also says October snowstorms are "not unusual." Our Bryce Canyon from Provo guide covers the shuttle and lodging.
Cedar City, on I-15 below the plateau, sits between Provo and St. George in temperature: a 91-degree July high, a 42.8-degree January high, and about 169 nights a year at or below freezing.
Southwest desert: St. George and Zion
St. George is Utah's warm corner in the normals: a 54-degree January high and lows near 28, about 1.2 inches of snow a year, and only about 63 nights at or below freezing. That's why it's the go-to winter and early spring trip from Utah Valley; our Snow Canyon and St. George winter guide covers it. Summer is the opposite: a 101.9-degree July high, about 128 days a year at 90 or hotter and about 63 at 100 or hotter. June is the driest month at 0.16 inches.
The Zion National Park station, at the canyon floor near Springdale, tracks St. George within a few degrees: a 100.3-degree July high and about 50 days at 100 or hotter. Its precipitation is very different, though, at 16.27 inches a year. The Park Service says "nearly half of the annual precipitation in Zion Canyon falls between the months of December and March," and the normals agree: December through March adds up to about 7.7 inches, or about 47 percent of the year.
The Park Service describes Zion's seasons this way. In March and April, days warm but nights stay cold, "the daily temperature swing can be 32°F / 0°C or more," and melting snow can close the Narrows for an extended period. March brings "almost three times as many visitors as in February." From May through September, highs regularly top 100 degrees, monsoon season runs July through September, and parking is often full by 9 a.m. In October and November, high and low temperatures "can vary by 30°F each day." From December through February, highs run 50 to 60 and nights drop "well below freezing." Snow usually melts within hours at lower elevations but builds up higher. For what stays open, see our Zion in winter guide.
Month by month across the state
January. The coldest month nearly everywhere. Alta averages 74.7 inches of snow; Vernal's high averages 29; Provo is in inversion season. St. George and Zion average highs near 54, which makes them the obvious escape. Bryce and the desert parks are open but cold, and small amounts of ice can close trails at Arches and Canyonlands.
February. Alta's snowiest month in the normals at 81.2 inches. Moab and St. George warm several degrees from January. Zion's precipitation peaks at 2.06 inches.
March. Spring break month. St. George averages 68 and Moab 65, but the Park Service warns of 32-degree daily swings at Zion, snowmelt closures in the Narrows, and heavy snow still possible at Bryce. Zion's visitation nearly triples from February. Our spring break from Provo guide covers the options.
April. The desert parks' good season begins: Moab averages a 72-degree high and the Park Service calls April through May temperate at Arches and Canyonlands. Bryce averages 54 and can still get storms. Alta still averages 50 inches of snow.
May. Last comfortable month for long hikes in the low desert. St. George and Zion average highs of 85 and 84, and Zion averages about 10 days at 90 or above. Provo's wettest month in the normals.
June. The heat arrives. St. George averages 96, Moab 94, and June is the driest month at most southern stations. Bryce averages 75, the start of its best stretch.
July. Peak heat: St. George about 24 days at 100 or above, Zion about 20, Moab about 18. The monsoon begins. Bryce averages 80 with 11 thunderstorm days, and Alta averages 73.
August. Monsoon and heat together. Capitol Reef's wettest month (1.14 inches) and Bryce's stormiest (12 thunderstorm days). Slot canyons carry the most risk.
September. Still hot early in the south; Zion averages a 91-degree high. Monsoon season usually ends this month at Zion and Capitol Reef. Vernal's wettest month. The desert parks' temperate season returns mid-month.
October. For most of the state, the best month. Moab averages 74, St. George 79, Zion 78, Provo 69. It's also Moab's wettest month in the normals (1.03 inches), and the Park Service says October snowstorms at Bryce are not unusual. Alta averages 24 inches of snow.
November. Cooling fast. Moab averages 57, Zion 64, Bryce 46. Zion's visitation drops sharply, per the Park Service. Alta averages about 54 inches of snow.
December. Short days and snow in the mountains: Alta averages 79.8 inches, Provo 11.2, and Moab gets most of its 9.3-inch yearly total this month (4.9 inches). St. George averages a 53-degree high.
Safety: heat, flash floods, lightning and cold
Heat. The National Weather Service says "young children and infants are particularly vulnerable to heat-related illness and death," along with older adults, pregnant women and people with chronic conditions. It also says it is never safe to leave a child, disabled person or pet locked in a car, "even in the winter." At St. George, Zion and Moab in July, plan hikes for early morning and carry more water than you think you need; Zion's seasons page tells summer visitors to carry plenty of water.
Flash floods. This is the hazard most likely to catch a Utah Valley group off guard, because the storm that causes it can be miles away. Zion's monsoon notice says rain falling 15 to 20 miles upstream, out of sight, can send water through the 288-square-mile watershed that feeds the Narrows. The park's Narrows safety page says the river is closed when the National Weather Service issues a Flash Flood Warning, and that during a flash flood water rises "within minutes or even seconds." Zion rates flash flood potential as not expected, possible, probable or expected, and says any rating above "not expected" should be "a serious cause for concern."
On the road, the National Weather Service says "it takes just 12 inches of rushing water to carry away most cars," two feet can carry away SUVs and trucks, and six inches of fast-moving water can knock over an adult. Over half of flood-related drownings, it says, happen when a vehicle is driven into flood water. Turn around at flooded washes and dips, which are common on southern Utah back roads.
Lightning. Bryce's July and August storms bring frequent lightning, and the Park Service's advice is short: go indoors when you hear thunder. Exposed rims, overlooks and summits are the wrong place to wait out a storm.
Cold water and cold nights. Zion's Narrows safety page calls hypothermia "the number one killer of outdoor recreationists," even in summer, and lists average water temperatures of 56 to 68 degrees in summer, 41 to 53 in spring and fall, and 38 to 45 in winter. Desert nights are colder than visitors expect: Moab averages about 117 nights a year at or below freezing, and Bryce about 216.
What to bring
- Layers in every season. With 30- to 40-degree daily swings in the desert parks, a warm jacket for morning and evening is standard even in October and April.
- More water than seems reasonable from May through September in the south, plus salty snacks.
- Sun protection. Shade is scarce on slickrock, and the high plateaus are close to 8,000 feet.
- Rain shell for July and August anywhere, and especially at Bryce.
- Traction gear in winter. Microspikes for icy trails at Arches, Canyonlands or Bryce, and tires or chains that meet UDOT's traction rules for canyon roads.
- A paper map or offline map, in case you lose cell service or need to reroute around a closure.
Who should skip which month
- Families with small children, older travelers and anyone with heart or heat-related health concerns should skip strenuous desert hikes from June through August, when St. George, Zion and Moab average highs of 94 degrees or more.
- Slot canyon and Narrows hikers should keep July through September plans flexible and walk away when flash flood potential is anything other than "not expected."
- Drivers without winter tires or chains should skip Bryce, Alta and high-country routes from December through February unless the forecast is clear, and check UDOT before leaving.
- Anyone who dislikes crowds might skip Zion in March and from May through September, based on the Park Service's own visitation notes.
What to check before you go
- The point forecast. Get the National Weather Service forecast for the exact location, which Zion's monsoon guidance lists first among its checks; a forecast for "Moab" is not a forecast for a trail 2,000 feet higher. The Weather Service's Salt Lake City office also posts watches, warnings and flash flood information on its site.
- The park's conditions page for closures, road status, and flash flood potential ratings where the park publishes them.
- UDOT Traffic at udottraffic.utah.gov for road weather, cameras, plow locations, seasonal road closures and current traction restrictions.
- Your drive home. US-6, US-40 and I-15 over the high country can be fine on the way down and snowy on the way back.
- Daylight. Short winter days cut hikes shorter than the temperature does; our Provo sunrise and sunset page has the valley's daylight by month.
Sources and limits
Temperature, precipitation, snowfall and day-count figures are NOAA NCEI's 1991-2020 monthly normals for stations USC00427064 (Provo BYU), USW00024127 (Salt Lake City airport), USC00420072 (Alta), USC00429111 (Vernal), USC00425733 (Moab), USW00023170 (Hanksville), USC00421008 (Bryce Canyon headquarters), USW00093129 (Cedar City airport), USC00427516 (St. George) and USC00429717 (Zion National Park), downloaded Nov. 13, 2026. Park-specific statements come from the weather and safety pages of Arches, Canyonlands, Capitol Reef, Bryce Canyon and Zion National Parks. Safety figures come from the National Weather Service. Drive times are estimates. The Utah Climate Center at Utah State University runs more than 140 research-grade stations whose data it publishes free, and is the place to look for a location these stations don't cover. Normals describe the past 30 years; they do not predict next week.
Related Guides
- The Utah National Parks from Provo, Ranked by Drive and by Season
- Utah's Three Landscapes: The Great Basin, the Colorado Plateau and the Rockies
- Provo Weather by Month
- How Much Snow Provo Gets, by Month
- Utah Winter Driving: The Traction Law, Chains and Canyon Rules
- Things to Do in Utah in Winter
- Things to Do in Utah in Summer
- The Utah Mighty 5: How Many Days You Really Need
Frequently Asked Questions
What is the hottest place in Utah to visit in summer?
Where in Utah is cool in July?
When is monsoon season in southern Utah?
What are the best months to visit Arches and Canyonlands?
Does it snow in St. George and Zion?
How much snow does Alta get compared with Provo?
Why is Vernal colder than Alta in January?
Where should I check Utah weather before a trip?
Sources
The facts in this guide were checked against these sources. Hours, fees and rules change, so confirm anything time-sensitive with the source before you go. How we make Provo.com.
- U.S. Climate Normals (1991-2020), NOAA National Centers for Environmental Information. Checked November 13, 2026.
- 1991-2020 Monthly Normals, station files (Provo BYU, Salt Lake City Intl AP, Alta, Vernal, Moab, Hanksville, Bryce Canyon NP HQ, Cedar City Muni AP, St. George, Zion NP), NOAA National Centers for Environmental Information. Checked November 13, 2026.
- Weather - Arches National Park, National Park Service. Checked November 13, 2026.
- Weather - Canyonlands National Park, National Park Service. Checked November 13, 2026.
- Weather - Capitol Reef National Park, National Park Service. Checked November 13, 2026.
- Weather - Bryce Canyon National Park, National Park Service. Checked November 13, 2026.
- Spring, Summer, Fall, and Winter - Zion National Park, National Park Service. Checked November 13, 2026.
- The Narrows Safety - Zion National Park, National Park Service. Checked November 13, 2026.
- Visiting Zion National Park During Monsoon Season, National Park Service. Checked November 13, 2026.
- Turn Around Don't Drown, National Weather Service. Checked November 13, 2026.
- National Weather Service: Heat Safety, National Weather Service. Checked November 13, 2026.
- NWS Salt Lake City, National Weather Service. Checked November 13, 2026.
- Snow Tire, Chain and Traction Device Requirements, Utah Department of Transportation. Checked November 13, 2026.
- Utah Department of Transportation: UDOT Traffic, Utah Department of Transportation. Checked November 13, 2026.
- Utah Climate Center, Utah State University. Checked November 13, 2026.